
1. Reserving trends due to social inflation
Social inflation trends have been most evident in the continued adverse reserve development in certain long-tailed lines of business. This article focuses on the commercial auto liability (CAL), commercial excess and umbrella (CX&U), and hospital professional liability (HPL) lines, which have each experienced material and persistent adverse development of reserves since 2016, even with the slight softening in 2020. Research from the Casualty Actuarial Society and the Insurance Information Institute estimates that increasing inflation, defined as the impact from all forms of inflation (including social inflation) on insurance losses, added up to 30.8% for CAL and up to 34.0% for other liability occurrence losses related to accident years 2015 through 2024 (Lynch and Nibbelin 2025). In this paper, we focus on whether some actuarial methods picked up on social inflation trends sooner than other methods and whether trending development factors as a response to social inflation improves the accuracy of selected ultimates.
To study the effect of social inflation on commonly used actuarial methodology, we used publicly available annual statement data obtained from S&P Global Market Intelligence. We began by defining cohorts of 20 large nonmutual companies with minimal outside assumed reinsurance[1] for the CAL, CX&U, and HPL lines of business. These specifications allow us to perform an analysis of cohorts on a gross-of-reinsurance basis, which we believe can reveal a more complete impact of social inflationary trends as opposed to data reviewed on a net basis. Figure 1 shows the premium volume of the cohorts used in this study. Note that we use results from these cohorts interchangeably with “industry” results throughout this article.
The identification of the CAL cohort was the most straightforward, as CAL is reported as its own Schedule P line of business in the annual statement. However, neither CX&U nor HPL has its own Schedule P line of business. CX&U exposures are predominantly grouped with the Schedule P other liability occurrence line of business, and HPL is included within the Schedule P medical professional liability claims made line of business.
The CX&U cohort was defined as the other liability occurrence annual statement data of 20 large nonmutual companies with minimal outside assumed reinsurance having at least 50% of their other liability occurrence premium generated from CX&U.[2] The HPL cohort was defined as the medical professional liability claims made annual statement data of 20 large nonmutual companies with minimal outside assumed reinsurance having at least 50% of their medical professional liability claims made premium stemming from HPL.[3]
Throughout this article, “loss” or “losses” include both loss and defense cost containment expenses (DCCE). In addition, the term “ratio” is the sum of loss and DCCE divided by earned premium.
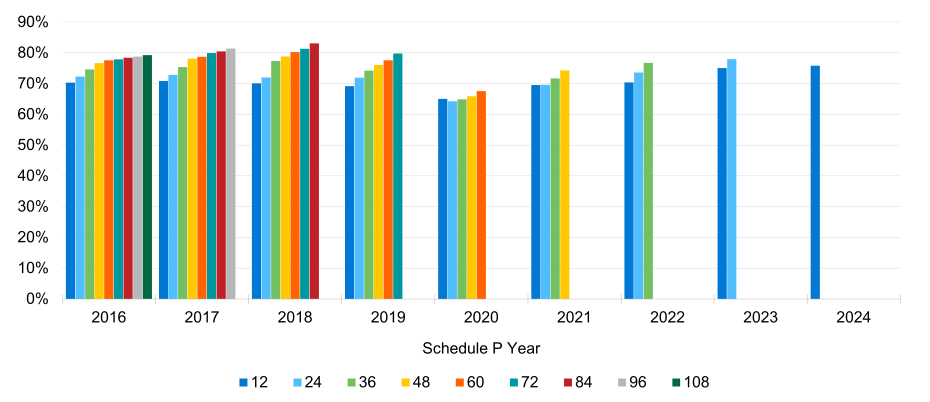
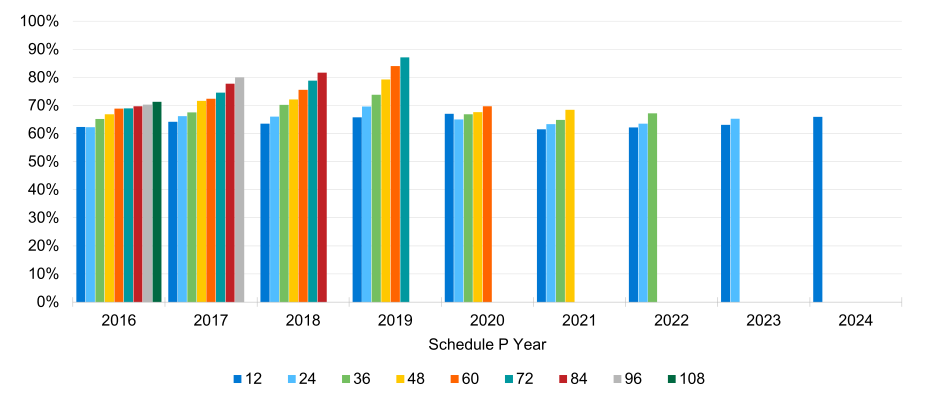
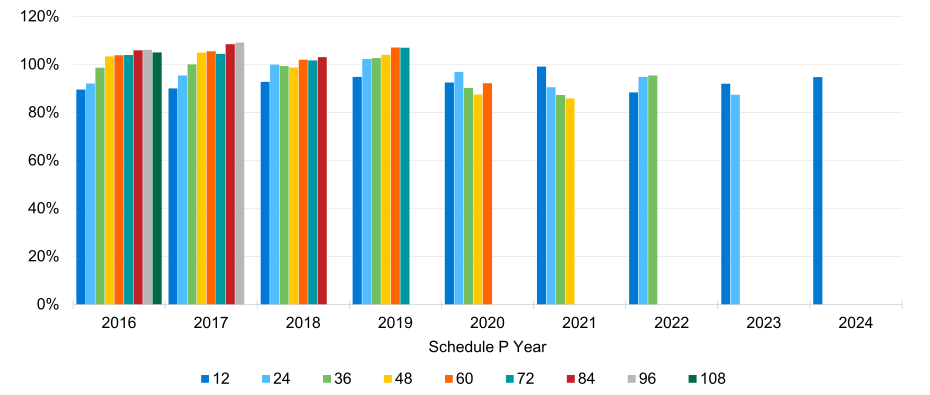
Figures 2, 3, and 4 contain aggregated annual statement data for each of the CAL, CX&U, and HPL cohorts, respectively. In each of the figures, the dark blue bar represents the gross ultimate ratios as the companies originally booked them at 12 months of development for each Schedule P year (accident year for CAL and CX&U, report year for HPL). The light blue bar represents the companies’ revised estimate after an additional calendar year of data is known (at 24 months of development). The green bar represents that same Schedule P year’s ultimate ratio after 36 months of development. The bar graph continues with 48, 60, 72, 84, 96, and 108 months of development.
Almost universally, as the months of development increase, the gross ultimate ratios are continually revised upward.
This upward development in the ultimate ratios tends to slow as Schedule P years reach the later stages of development, due to the cumulation of payments over time that both reduce the unpaid losses and serve to limit the magnitude of any additional development. Less-mature years appear to be following a similar stair-stepping pattern, suggesting that excess trends (and specifically social inflation) have been present for several years without the industry fully reacting to this emerging risk from both reserving and pricing perspectives. We have not observed any indications that social inflation is easing, based on takeaways from the September 30, 2025, industry data and our experience;[4] therefore, we believe that these Schedule P years will continue to develop adversely.
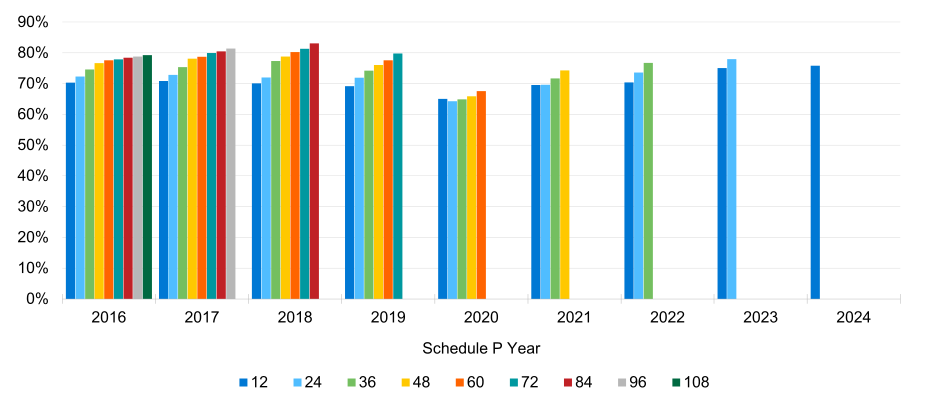
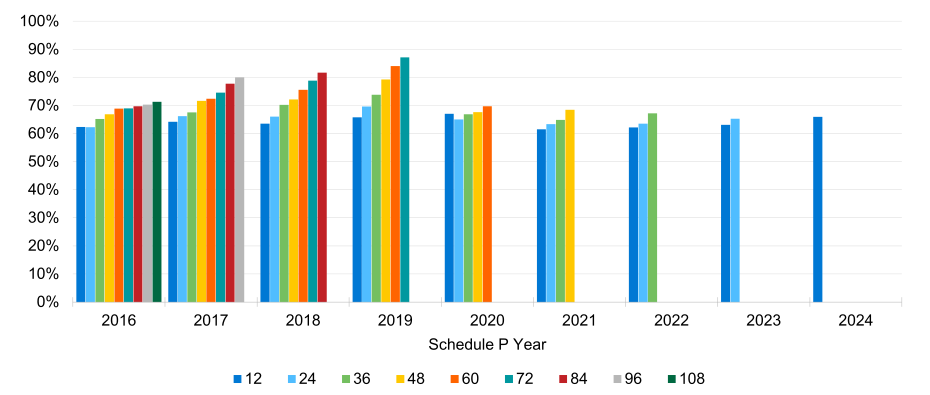
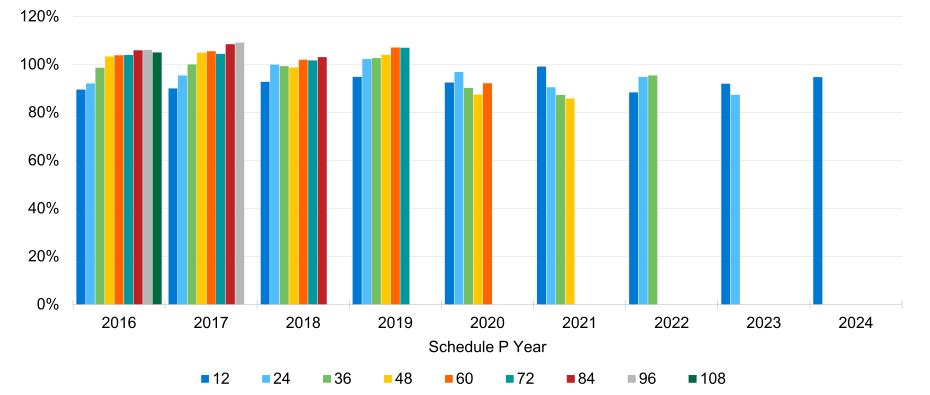
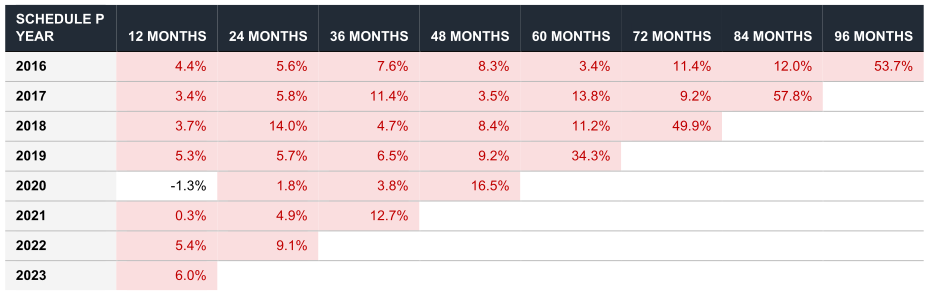
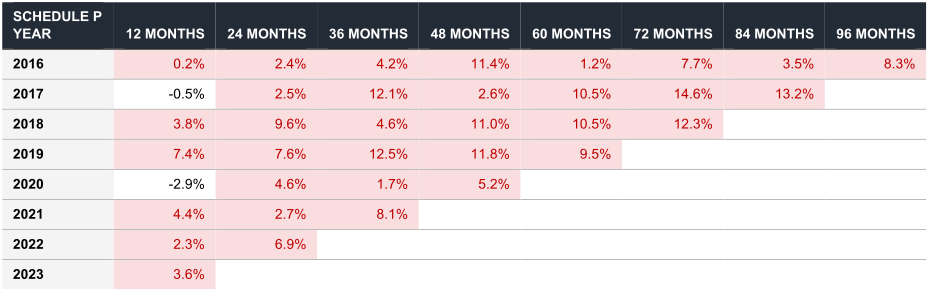
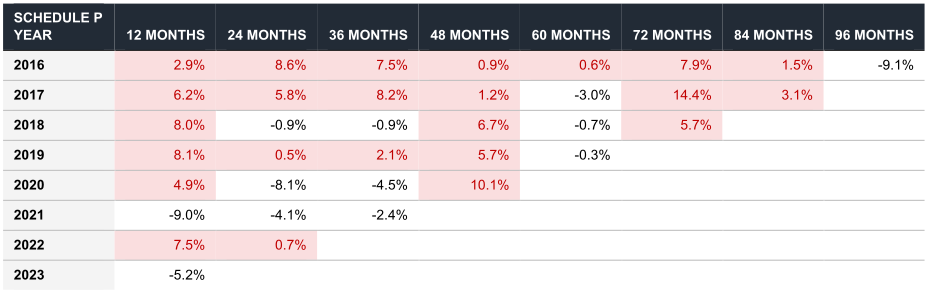
As each Schedule P year matures, the cumulative payments made to date reduce the remaining unpaid losses, which in turn limit the magnitude of future stair-stepped adverse development, as Figures 2 through 4 illustrate. An alternative view of the reserve development considers this change in ultimate ratio expressed relative to the Schedule P year’s unpaid losses at the prior valuation. As an example, if the ultimate at the prior valuation was $100, and $80 had been paid, then $20 is unpaid as of the prior valuation date. Then, if the current valuation shows that ultimates increased from $100 to $105, this $5 change in ultimate implies a 25% increase (= $5 / $20) relative to prior unpaids. If reserve development is consistently positive, this suggests widespread reserve deficiencies. In Figures 5, 6, and 7, for each cohort, the red numbers provide the magnitude of positive incremental reserve development relative to prior year-end reserves. This alternative view of the reserve development also highlights the underreserving that has been happening in our cohorts year after year.
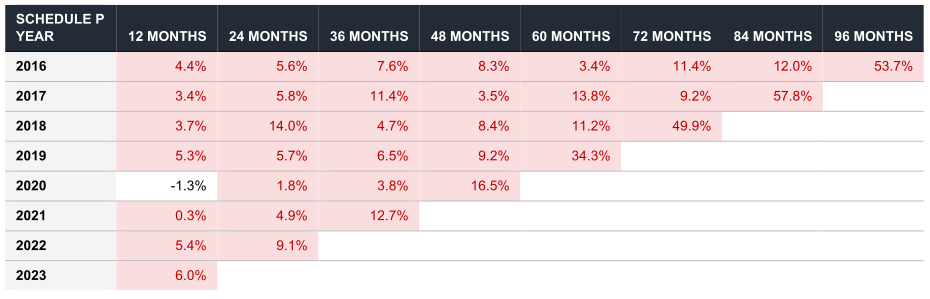
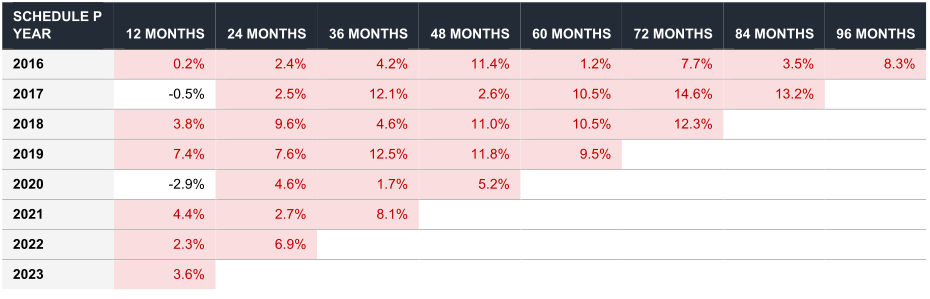
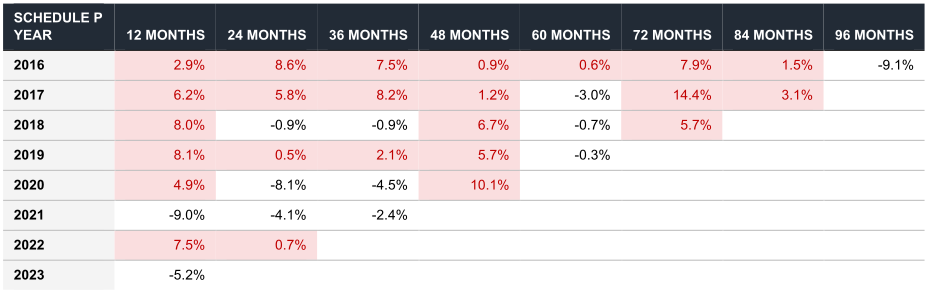
In addition to the reserve adequacy diagnostic in Figures 5 through 7, we were able to study anonymized client HPL claim history to see the changes in paid loss severity over time. We found that between 2009 and 2013, 0.05% of HPL claims closed for more than $10 million. Between 2019 and 2023, though, 0.28% of HPL claims closed for more than $10 million.[5] This represents a 450% increase from the five-year period just a decade prior, which implies a far greater impact than general inflation over that same period.
Another component contributing to claims severity is increased attorney involvement in claims. According to a study by Sedgwick (2025), the number of general liability claims with attorney representation grew from 72% to 79% of all claims from calendar year 2020 to calendar year 2024. The same period saw auto liability attorney representation grow from 69% to 92%.
A byproduct of more frequently litigated claims is an increase in the length of time that claims remain open, which we refer to as “claim duration.” Claim duration is an important consideration when estimating claim liabilities, as claims with a longer duration often have higher indemnity costs and typically incur more defense costs and administrative fees. An article by Milliman’s Eric Wunder and Leah Windt (2023) notes that the average duration of medical professional liability (MPL) lawsuits jumped from 2.6 years for lawsuits closing between 2017 and 2021 to 3.2 years for lawsuits closing in 2022. “As of 2025 Q2, durations remain elevated,” Windt said when asked about the current state of MPL durations (Leah Windt, direct conversation with author, September 18, 2025). While some of this lag is understood to have emerged from the COVID-19 pandemic, there is no evidence that durations have returned to their pre-COVID levels. This increased duration and other components of social inflation are likely to cause recent year reserves to be understated if these trends are not considered.
2. Early detection methods
Given the pervasive adverse development of several long-tailed liability lines of business, we designed a case study to determine whether any actuarial methods were able to pick up on the trends of social inflation more quickly than other methods. For each of our three cohorts, we calculated ultimate ratios using the following five actuarial methods:
-
Chain ladder
-
Bornhuetter–Ferguson (BF) method with frozen assumptions (BF frozen)
-
BF method with updated assumptions (BF updated)
-
Benktander method[6] with frozen assumptions (Benktander frozen)
-
Benktander method with updated assumptions (Benktander updated)
For our CAL, CX&U, and HPL cohorts described at the beginning of this article, we aggregated Schedule P Part 1 data from statement years 2014 to 2024. The five methods were tested on each of the three aggregated cohorts. To minimize the impact of any minor company reporting inconsistencies between years, gross ratios rather than actual losses were used to calculate reported development factors. Each of the methods used in this case study requires the selection of development factors. Due to the volume of our aggregated data and its relative stability, we selected the average of the last two diagonals for our development factors. The BF method requires the selection of an initial expected a priori ultimate ratio, which we chose as the average of the last two Schedule P years from the first prior valuation. As an example, the average of the 2023 ratio at 12 months of development and the 2022 ratio at 24 months of development was selected as the CAL a priori ultimate ratio for the 2024 Schedule P year. Note that for CAL, an adjustment was made to exclude abnormally low ratios in the 2020 accident year due to COVID.
One more important clarification regarding our methodology and selections is the distinction between frozen and updated assumptions. Frozen development factors and BF a priori were not updated at subsequent analyses. For example, for the 2016 Schedule P year, regardless of the valuation date of the analysis (e.g., December 31, 2016; December 31, 2017; etc.), the development pattern will always use the average of the 2014 and 2015 diagonals. Schedule P year 2017 will always use the 2015 and 2016 diagonals, and so on and so forth. This is different from the updated assumptions, for which development factors will always be based on the average of the most recent two diagonals. As an example, for Schedule P year 2016 with a valuation date of December 31, 2016, the development factors were based on the 2014 and 2015 diagonals. However, at the December 31, 2017, valuation date, the development factors for the 2016 Schedule P year were updated to be based on the 2015 and 2016 diagonals. For the BF updated method, the a priori ratio progresses from using the initial ratio described above to using the prior booked ultimate ratio at each valuation.
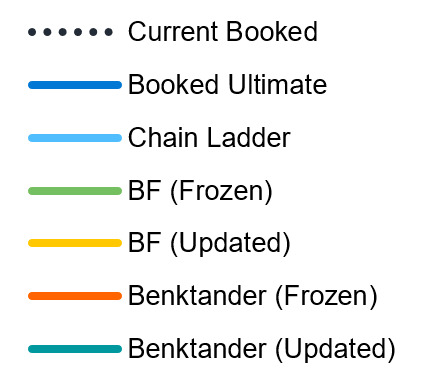
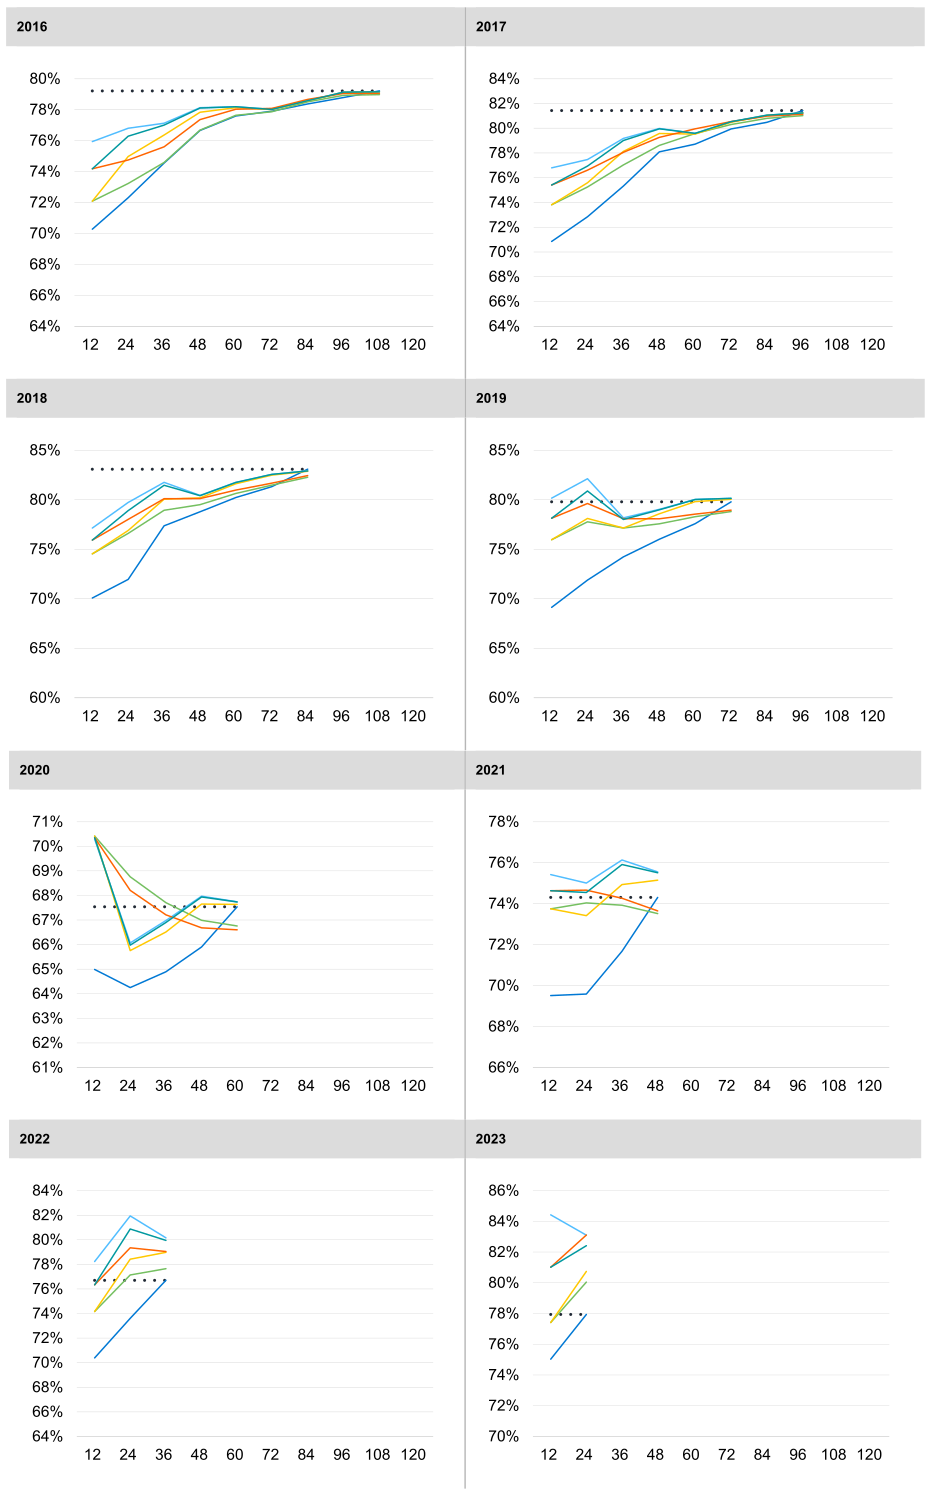
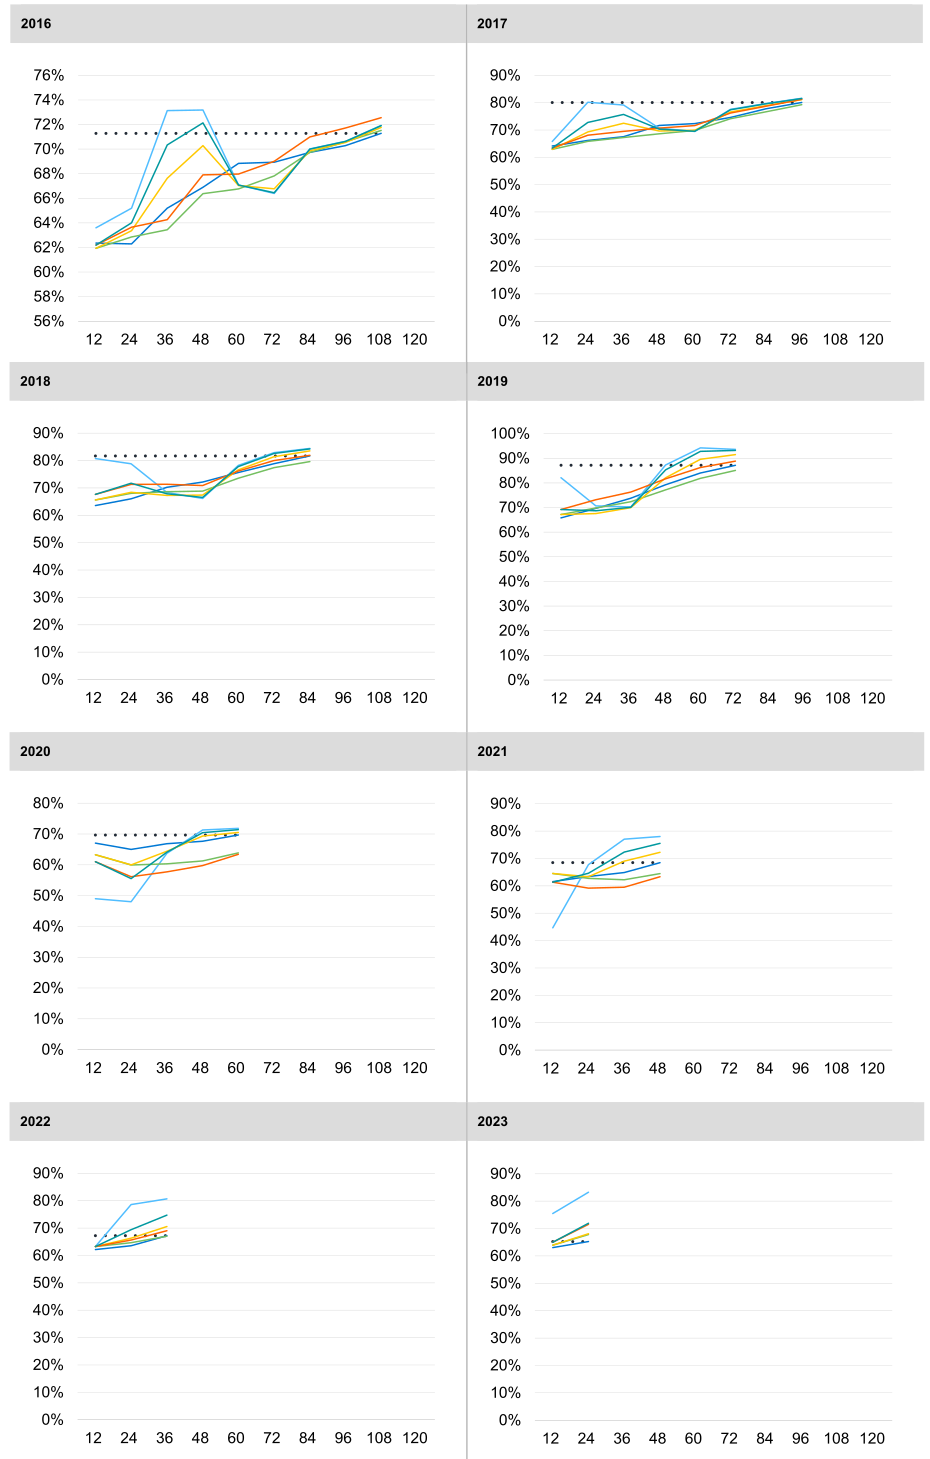
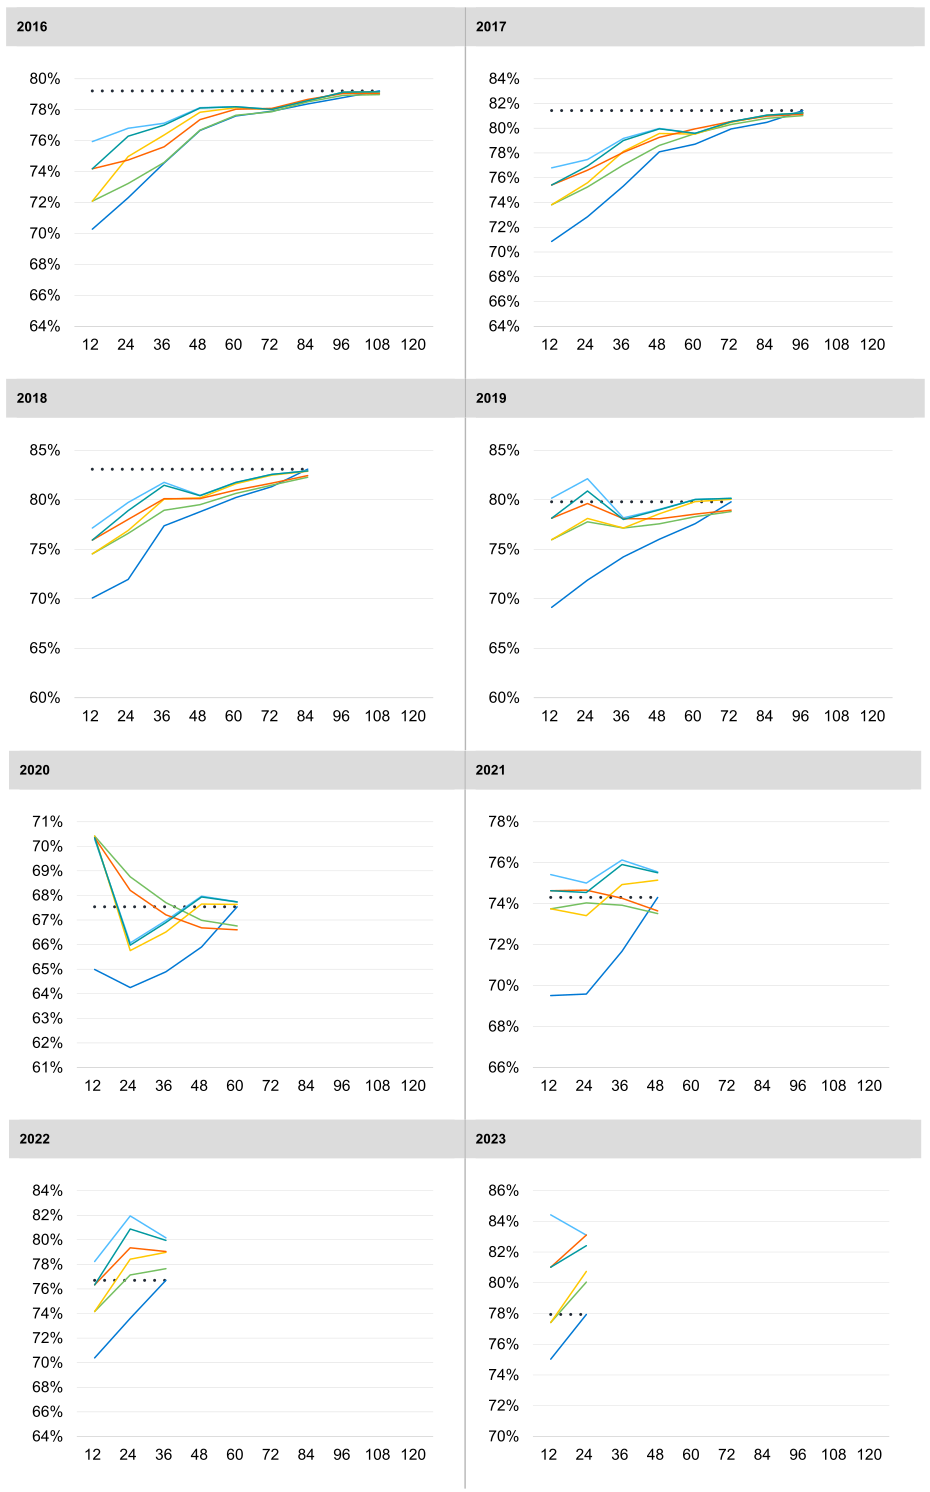
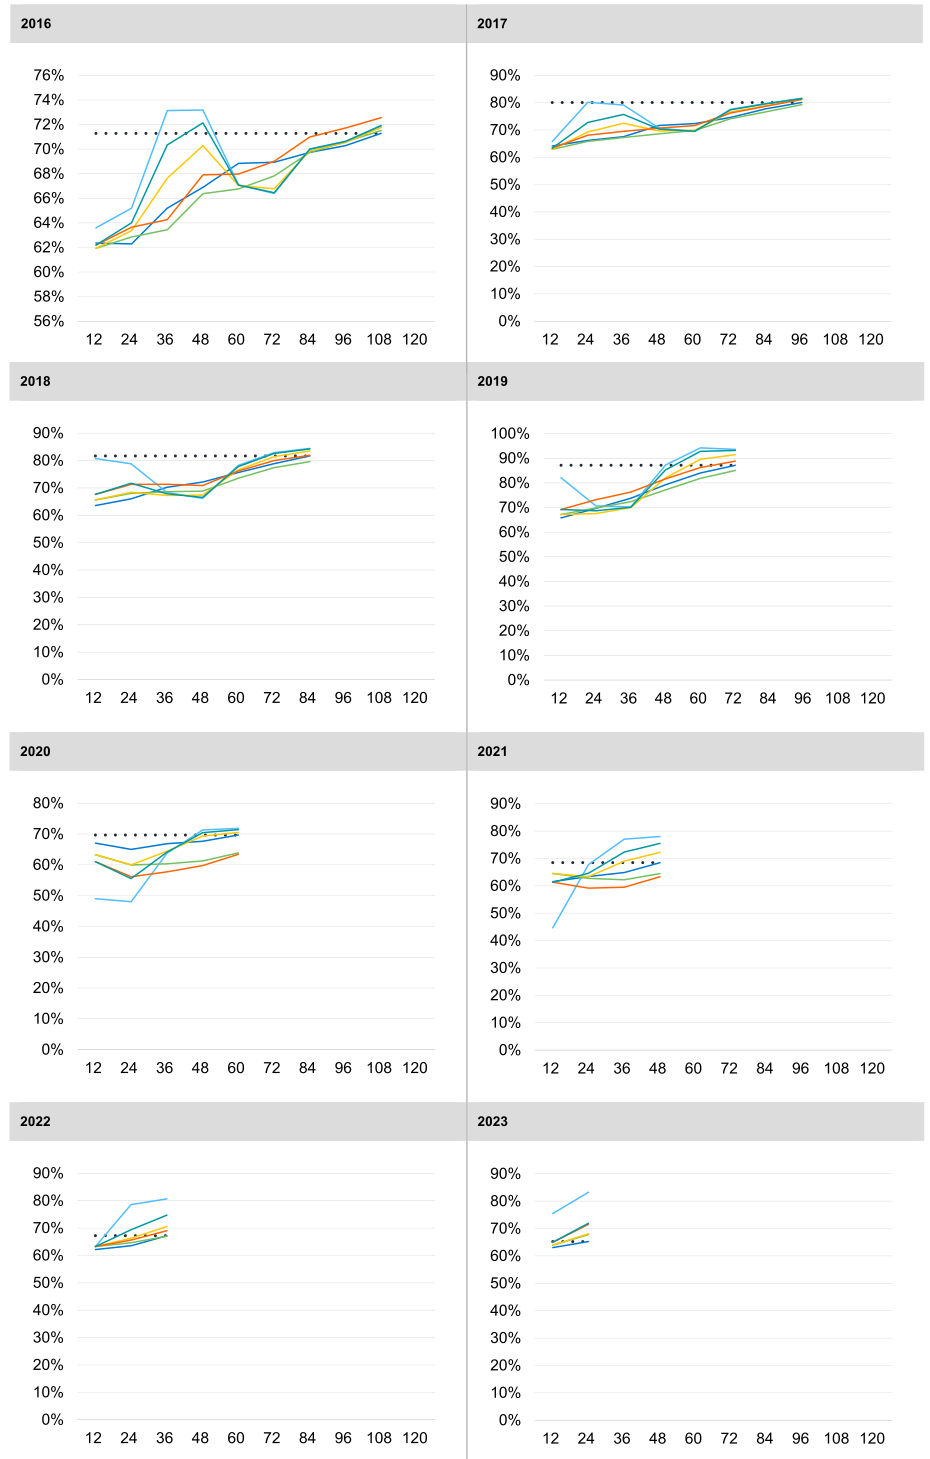
Figure 8 displays the CAL results of our case study examining the responsiveness of various actuarial methods to changes in the data. The year on each graph represents the Schedule P year of the data contained within that graph. For example, the 2016 graph in Figure 8 displays the estimated ultimate ratio for each of the five actuarial methods studied and the booked ultimate ratio (dark blue line) at each of the historical months of development. At 24 months of development (or as of December 31, 2017), the 2016 CAL booked ultimate ratio was 72%. At that same time, the BF frozen method was 73%, the BF updated method was 75%, the Benktander frozen method was 75%, the Benktander updated method was 76%, and the chain ladder method was 77%. A dotted black line shows the ultimate ratio booked as of December 31, 2024 (79%), which we note may not represent the final ratio after all claims are settled.
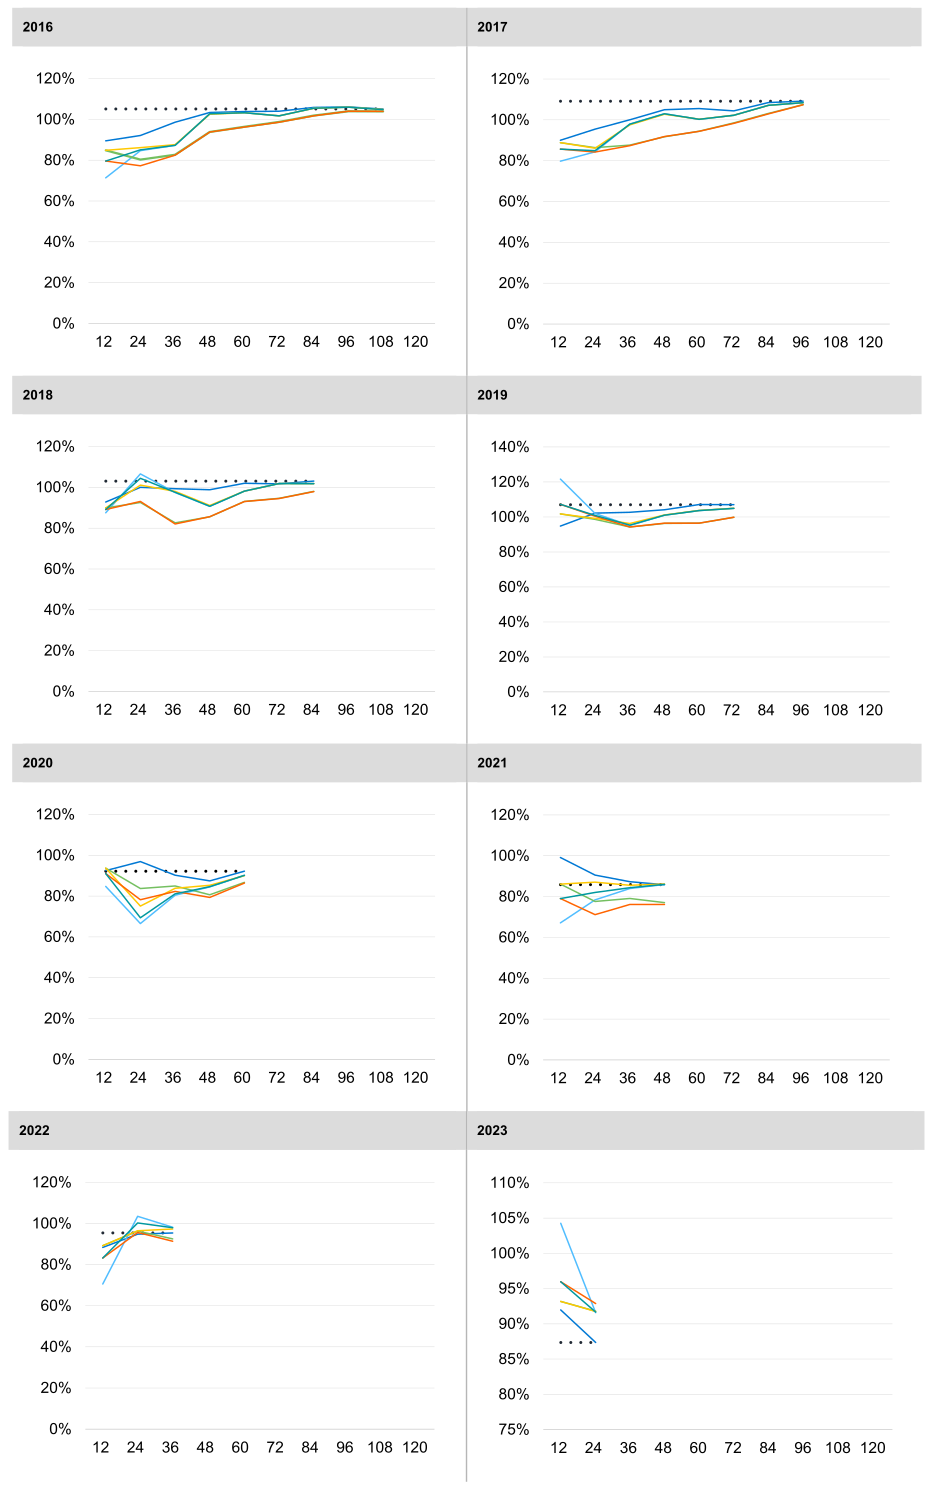
In Figure 8, the chain ladder method often appears to be the closest to the current estimate for the older Schedule P years. It is important to note that the chain ladder method in our case study is abnormally stable. Looking at Figures 8, 9, and 10, one might assume that the chain ladder, which by its nature is the most reactive to data, is our recommended method in instances of changing trends. However, for most individual companies, the chain ladder method can be quite volatile in early development periods due to lack of credibility of the loss experience. By aggregating data across 20 large companies, our case study masks the true volatility of the chain ladder method.
In Figure 8, we also note that the green line representing the BF frozen method is almost universally less responsive to the data than the gold line, which represents the BF updated method. We see a similar relationship when comparing the orange line, which represents the Benktander frozen method, and the teal line, which represents the Benktander updated method. Both updated methods are almost universally better predictors of the current ultimate ratios than their frozen counterparts.
In general, the Benktander updated method performs better than the BF updated method in this case study as measured by its results generally being closer to the currently booked ultimate ratios. This could be expected, as the Benktander method gives more credibility to the emerging claims data than does the BF method, which relies more heavily on the a priori. This allows the Benktander method to be more responsive to trends in the emerging experience compared to the other methods studied. With the changing environment resulting from social inflation, responding more quickly to trends can be beneficial.
When reserving for a line of business affected by social inflation, we recommend that actuaries refresh their assumptions frequently to capture changes in both expected losses (through the a priori) and the development patterns.
For CAL Schedule P years 2022 and 2023, many of the indications produced by the five methods in our case study are above the currently booked ultimate loss ratios. This could be a result of more recent years’ ultimate loss ratios relying on historical loss ratios that were initially booked too low.
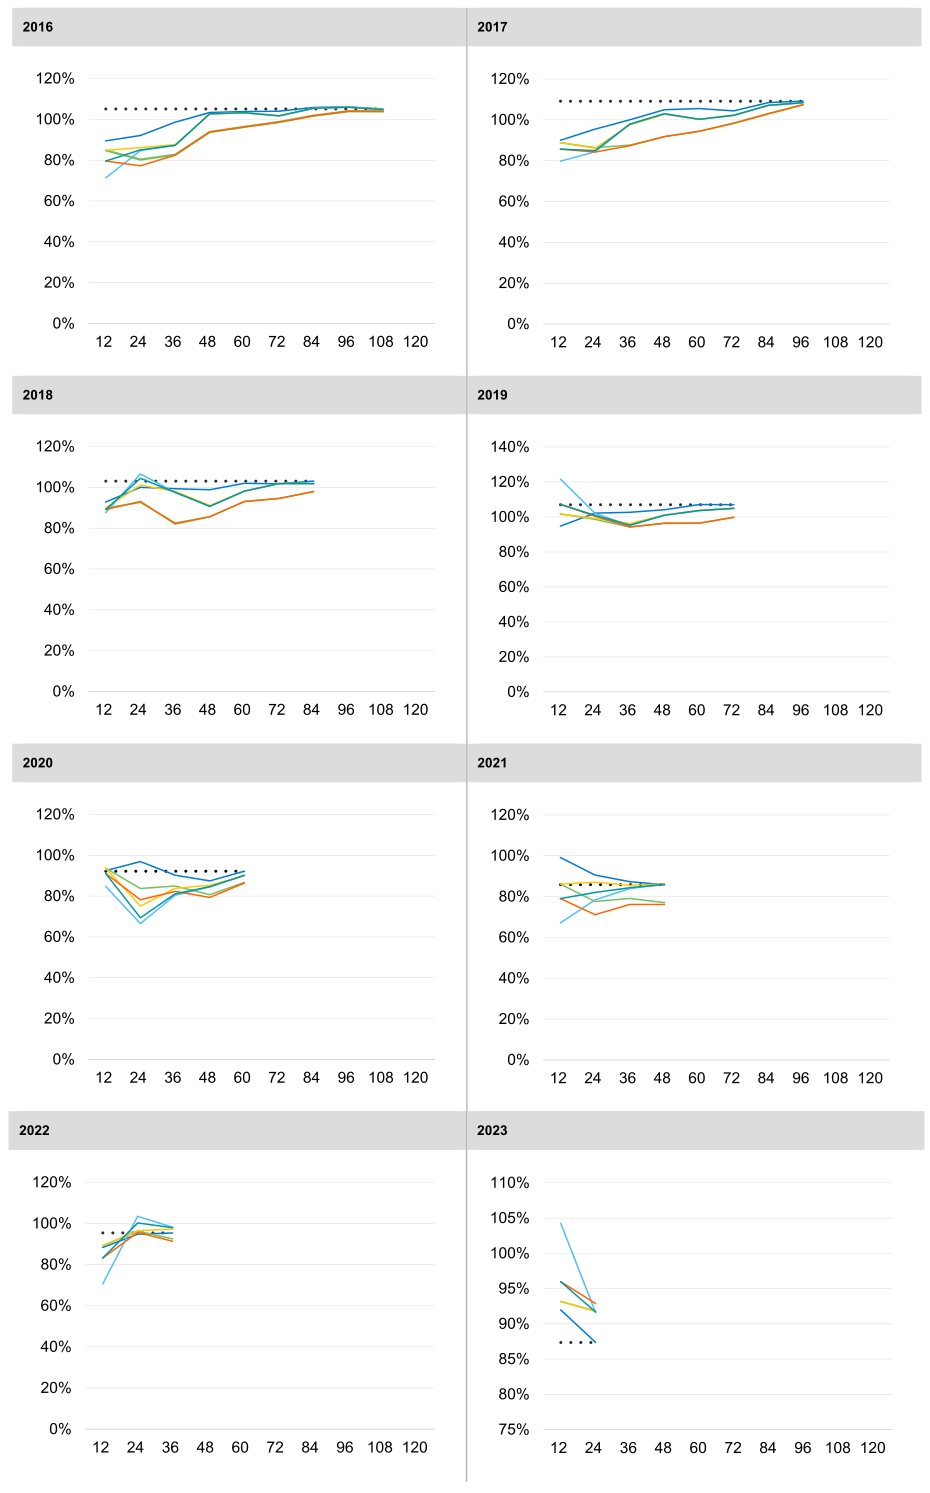
Figures 9 and 10 display the analogous results for CX&U and HPL. The CX&U results are similar to the CAL results. However, the HPL results are less clear. This could be due in part to the smaller cohort of data available for HPL.
___9_(350631)__and__10_(350633)_use_the_above_legend.png)
In addition to studying how updating development patterns and a priori assumptions affected the above methods, we explored trending the loss development factors to account for social inflation.
3. Back testing implied social inflation trends
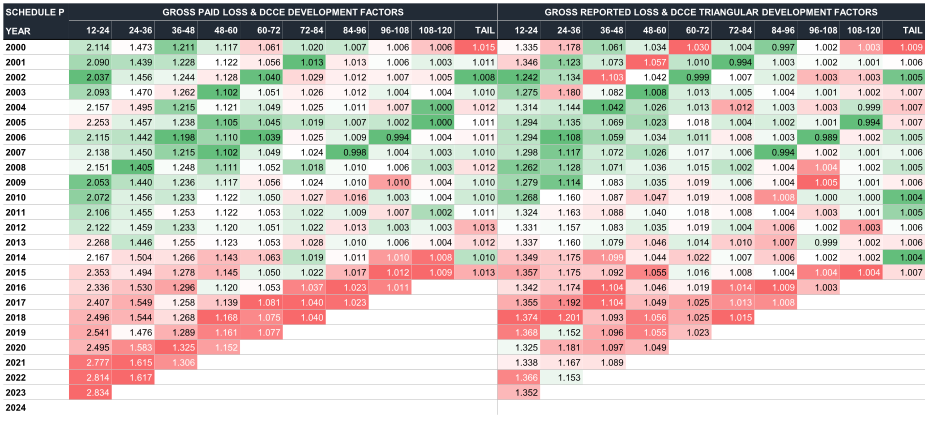
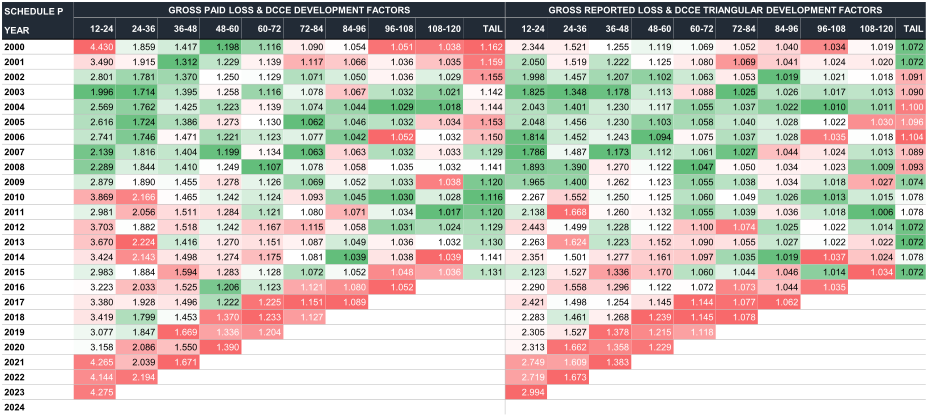
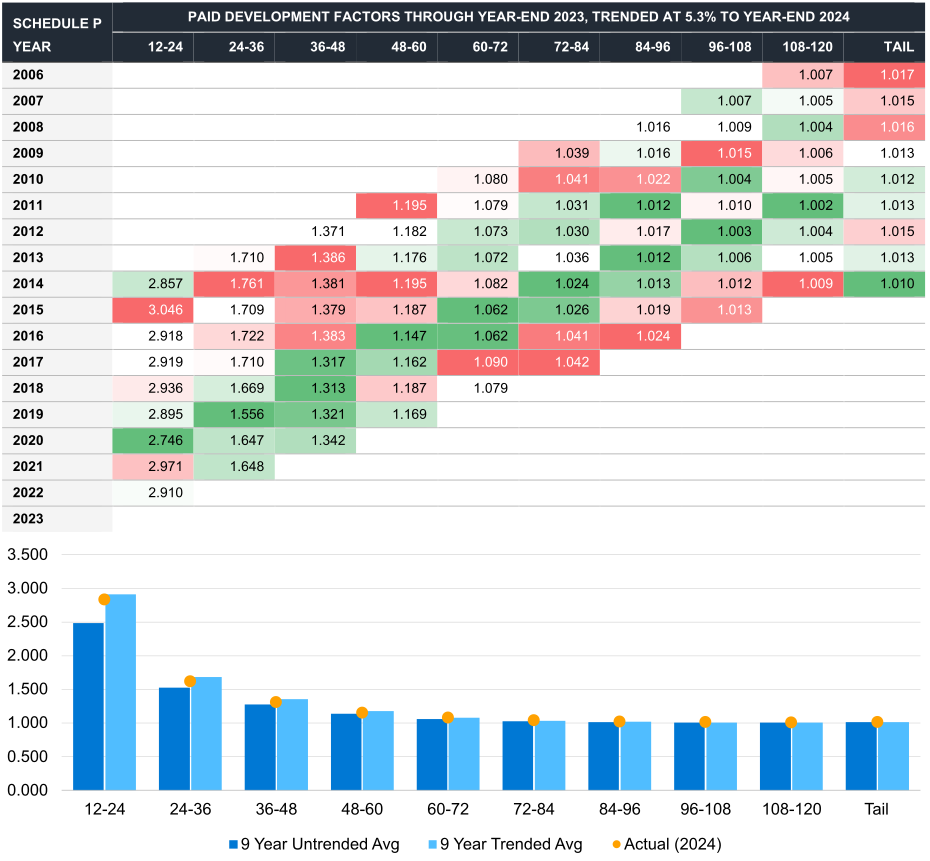
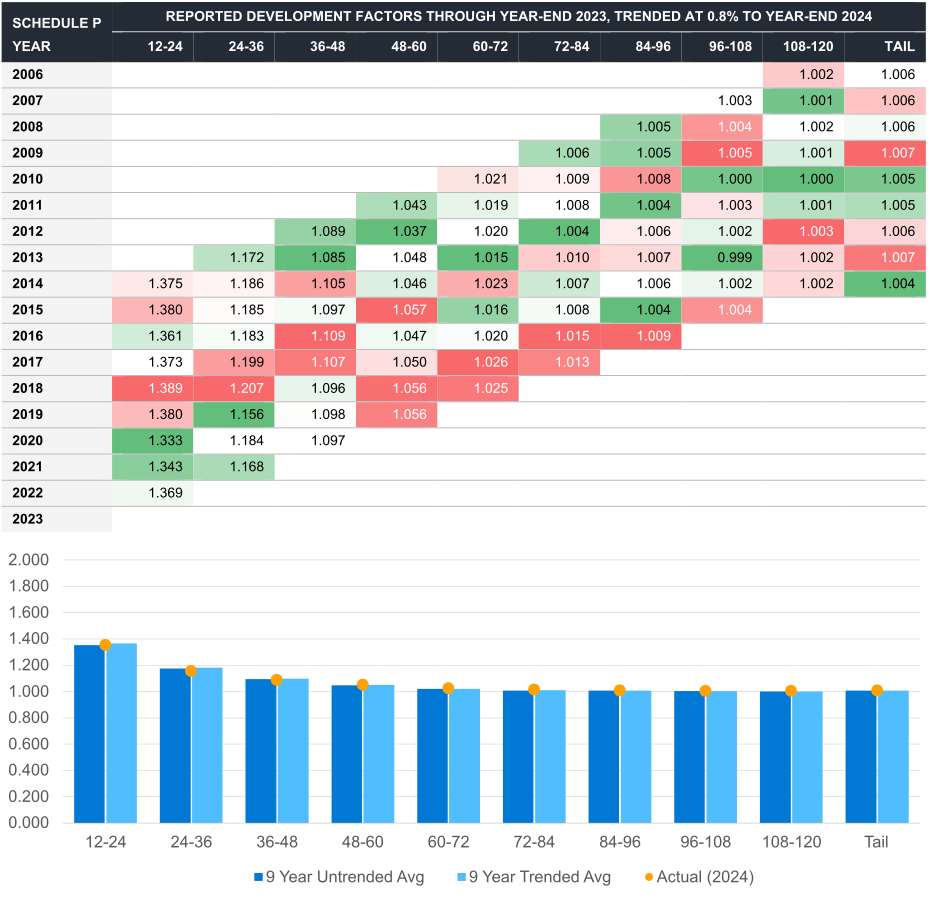
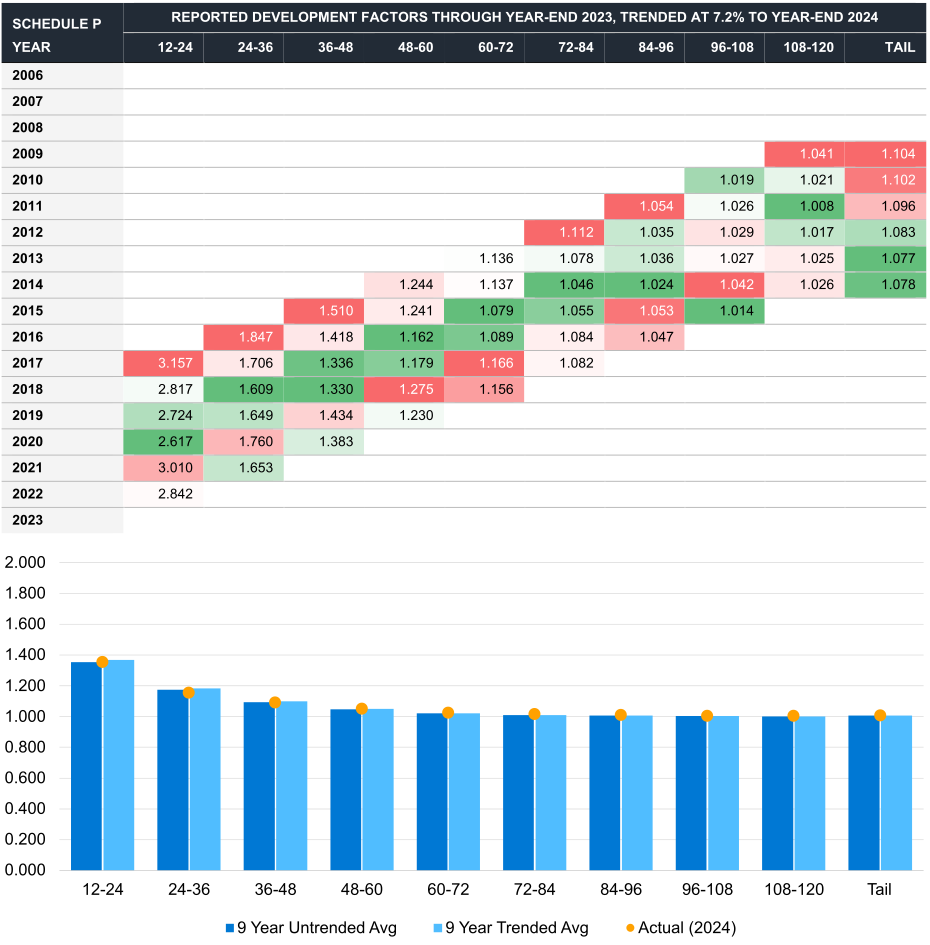
Through the case study described previously, we confirmed that in a changing environment, selecting methods that are more responsive to the data and updating the development patterns annually led to more accurate selections. However, in many instances, the methods still underpredict the ultimates in hindsight. As updating the development patterns in a changing environment improved the estimates, we hypothesized that trending the development factors might further improve the estimates. In an environment where the inflation rate is relatively stable year over year, the development factors naturally capture inflation. However, in an environment with excess inflation and/or social inflation, the development factors can increase down the columns and from one calendar year diagonal to the next. In Figures 11 and 12, higher development factors in a column are highlighted in red and lower development factors are highlighted in green. The most recent several diagonals contain far more red than older diagonals.
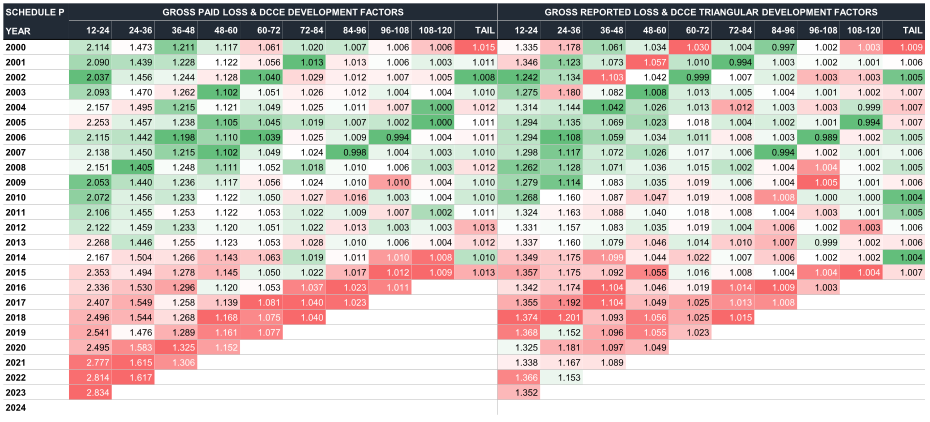
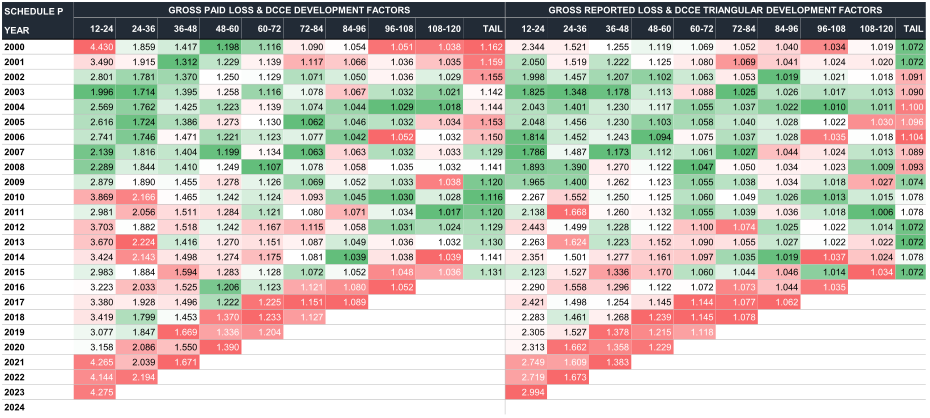
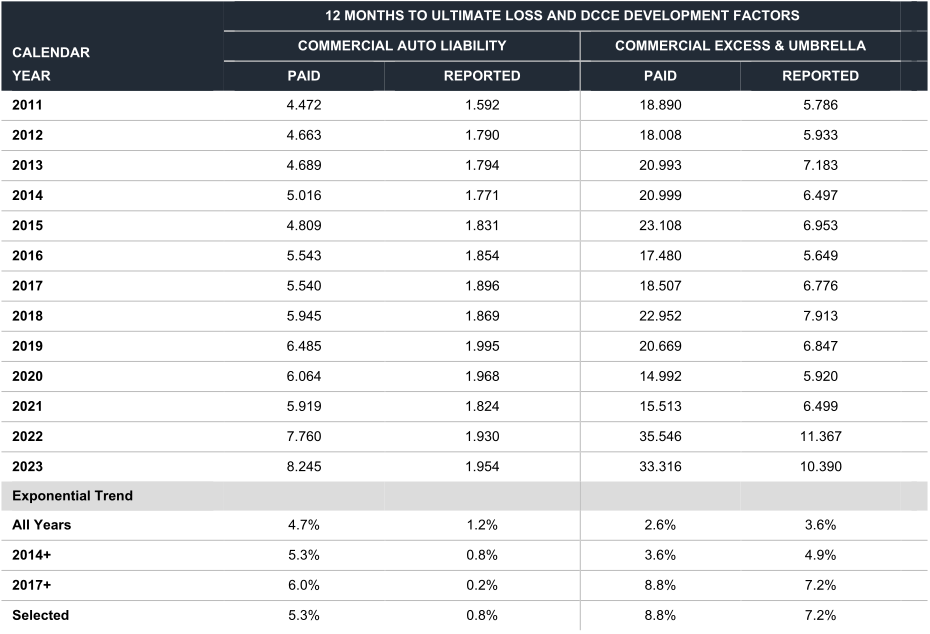
To test the hypothesis that applying an excess trend rate to the development triangle would lead to more accurate development factors, we performed the following steps to select a calendar year trend: First, we calculated 12-month to ultimate calendar year development factors along each diagonal from the triangles in Figures 11 and 12. Then, we calculated the exponential trend indications from these factors, as can be seen in Figure 13. We used only data through calendar year 2023 to fit this trend as we are testing how the trended development factors (blind to the calendar year 2024 factor) align with the most recent diagonal of development factors.
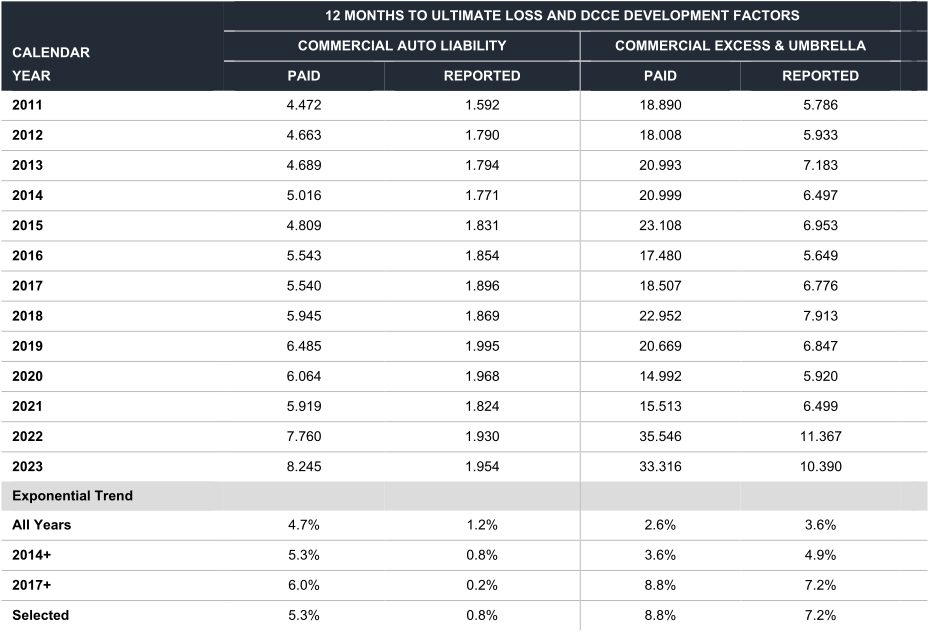
Whereas we would expect no discernable trend to be present in development factors, the conclusions from Figure 13 clearly show positive trend rates in these segments that correspond with what we believe to be excess trend due to social inflation. Of note, the CAL paid excess trend materially outpaced that of reported. The reason is not clear to us given the limitations in both data and approach, but we suspect early-maturity case reserve strengthening may play a part in suppressing the excess trend indication.
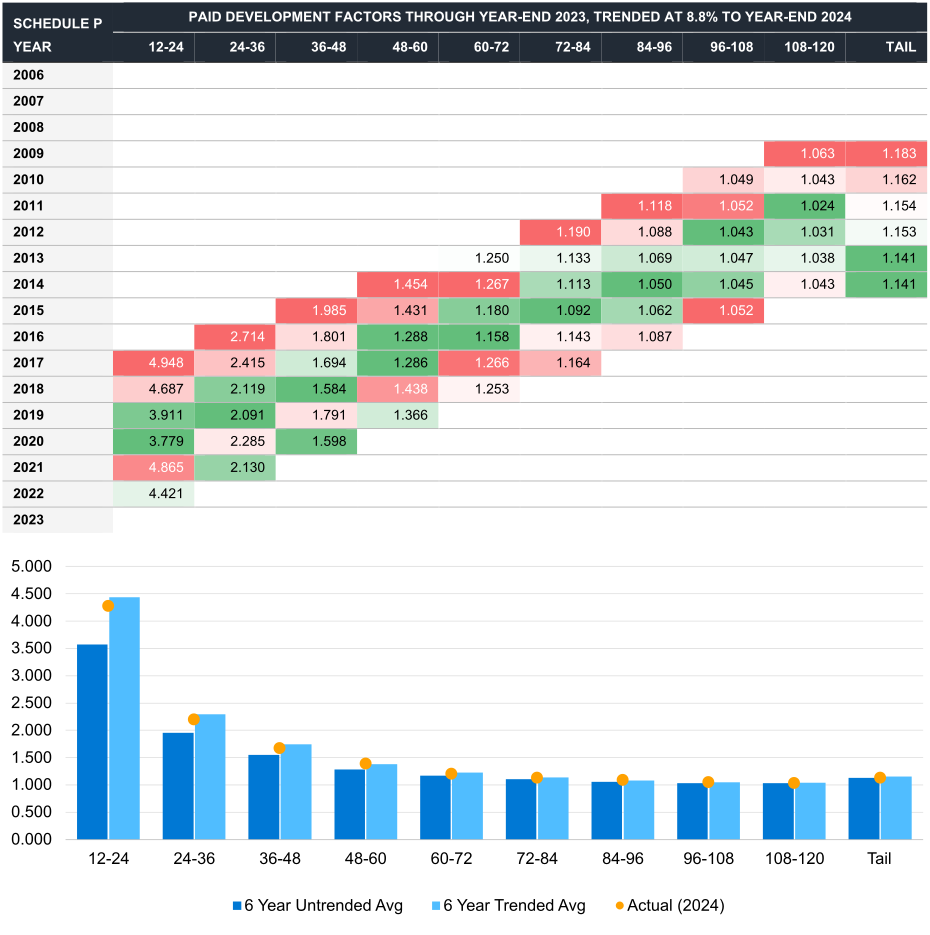
This is yet another reason that actuaries need to communicate with other departments to understand any remedies that may have been employed. The factors for CX&U may suggest that social inflation did not affect this segment as early as it did for CAL, but recent calendar year results may suggest the likelihood of a larger impact. As our goal for this exercise is to adjust prior factors to the current social inflationary environment, for CX&U we have elected to use more recent years to select the trend rate and development factors.
Although the concept of trending development factors may not currently be a common adjustment tool in actuarial methodologies, we note the existence of certain generally accepted methodologies that do adjust triangular data (and the development factors implicitly) in other situations, such as the Berquist–Sherman approach, which responds to a change in case reserve adequacy.
Using the selected trend rates in Figure 13, we adjusted the historical development factor triangles to reflect the excessive inflationary environment expected as of December 31, 2024. We then calculated straight average development factor indications at each month of development, from both untrended data (Figures 11 and 12) and trended data (Figures 14, 15, 16, and 17) during the period we believe is affected by social inflation (nine years for CAL and six years for CX&U, which correspond to our selections in Figure 13). We relied on straight averages because of the credibility and stability of our datasets, but alternative statistics may be more appropriate for a dataset with a smaller volume of data. Comparisons of the untrended and trended averages against the actual factors as of December 31, 2024, are provided in the charts shown in Figures 14 through 17.
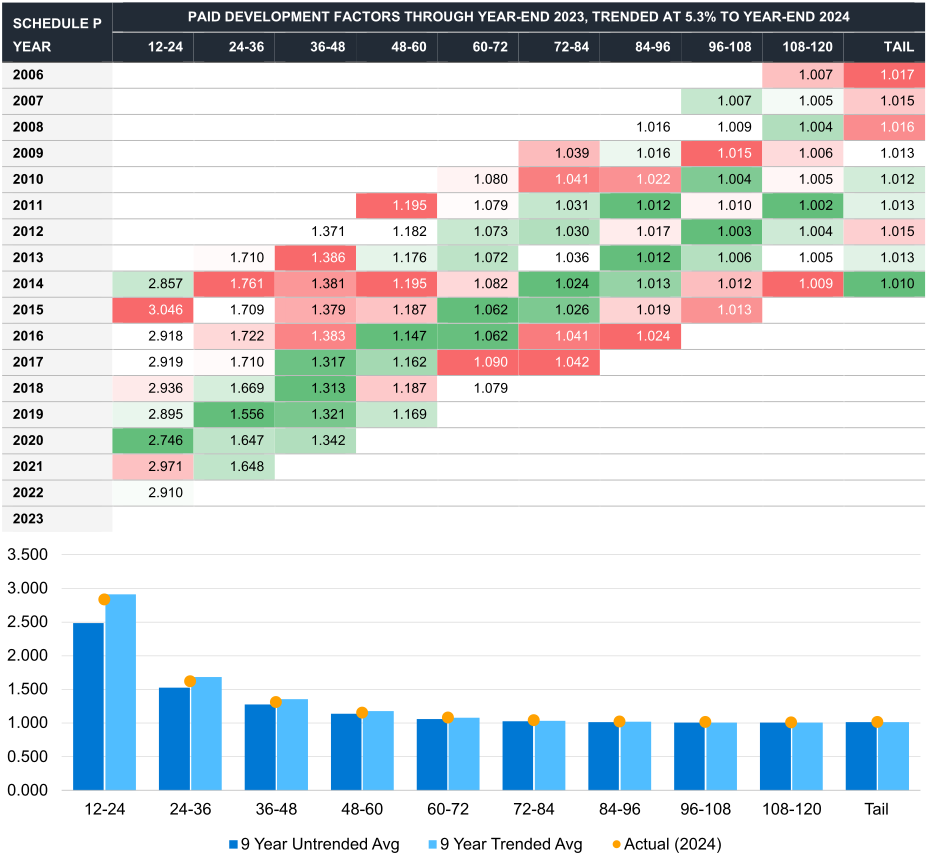
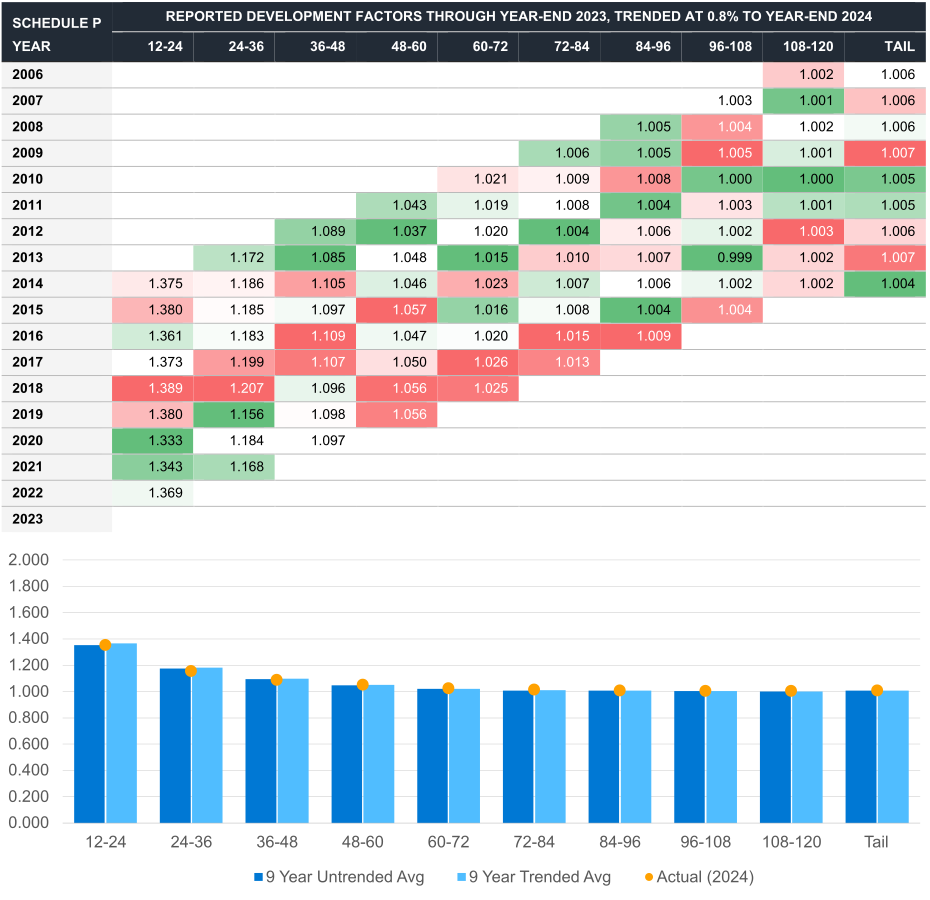
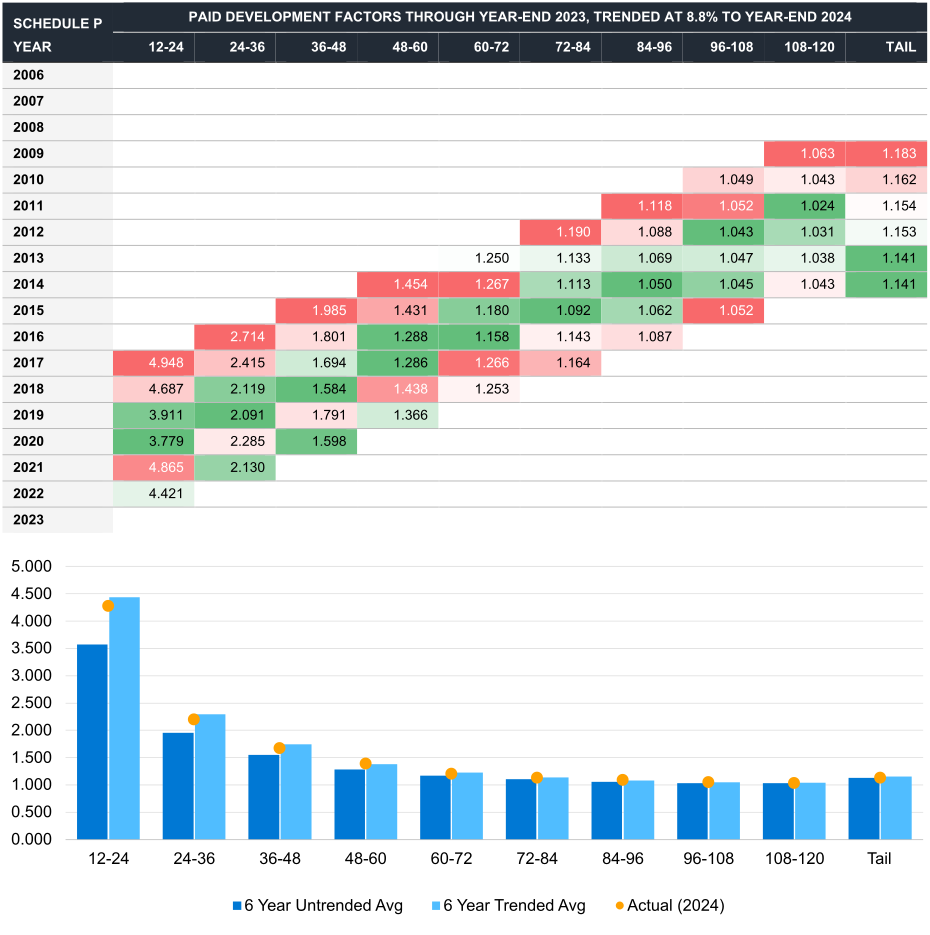
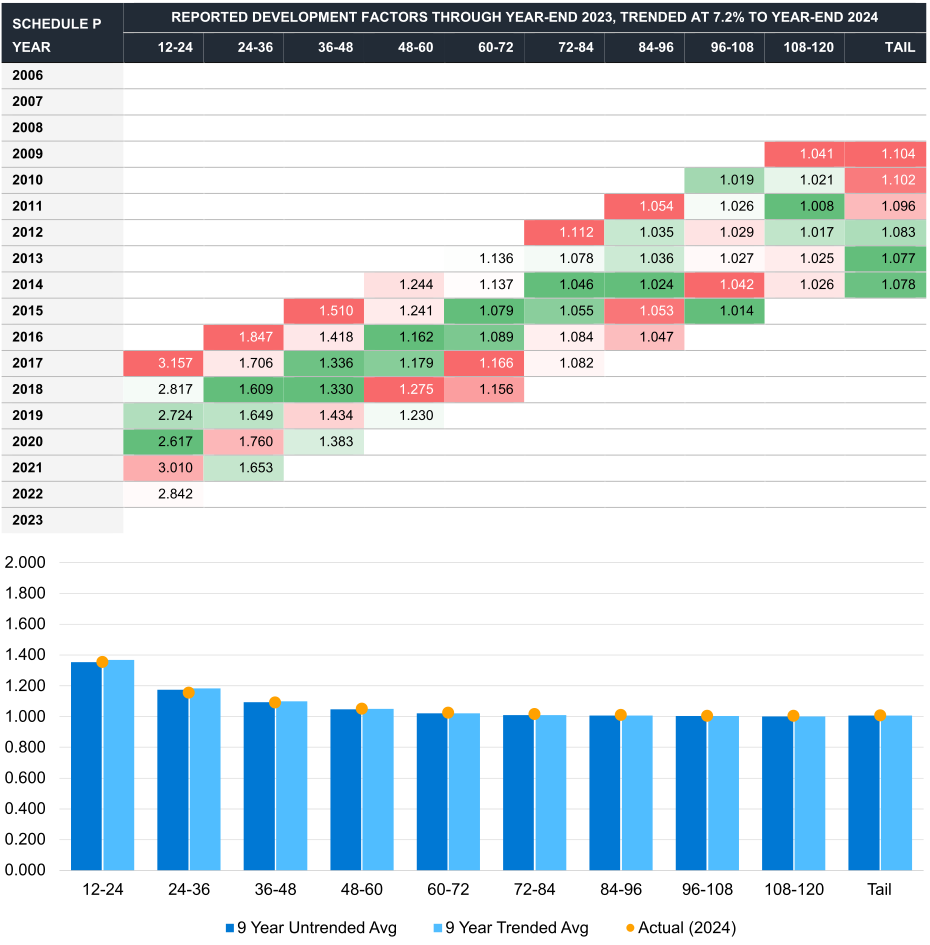
We note that as each Schedule P year reaches a point of maturity where development factors approach 1.000, excess trending has limited impact on the development pattern. It is therefore reasonable to conclude that this excess trend approach is most impactful for more recent Schedule P years.
When reserving for a segment affected by social inflation, the actuary could consider trended development factor methods in addition to refreshing development factors and a priori assumptions. These additional methods and refreshed assumptions may enhance the actuary’s ability to reflect excess inflation and reduce systematic underestimation of ultimates, especially in segments exhibiting large calendar year trends.
4. Lessons learned
The persistent adverse reserve development observed in CAL, CX&U, and HPL underscores that social inflation is not a passing anomaly, but a long-term trend affecting long-tailed liability experience. Our analysis demonstrates that actuarial methods that rely on frozen assumptions consistently lag emerging experience, while approaches that update assumptions and place greater credibility on reported data, particularly the Benktander updated method, respond more quickly and produce estimates over time that are closer to currently booked ultimates. Further, the exploratory back testing suggests that explicitly trending development factors may improve predictive accuracy in periods of accelerating social inflation, although results vary by segment and warrant further validation.
Taken together, these findings highlight the need for reserving practices that are both dynamic and forward looking, with frequent assumption refreshes, heightened skepticism of historical stability, and deliberate stress-testing of traditional methods. In an environment defined by rising claim severity, prolonged claim durations, and evolving litigation strategies, timely recognition of emerging trends is critical to maintaining reserve and pricing adequacy.
As our analysis relied on annual statement data, we wished to exclude companies with a large amount of outside assumed reinsurance to avoid counting the same experience from both the cedant and the assuming company as well as to reflect only business that the included company has control of from pricing and reserving perspectives.
Based on our analysis of the annual statement’s Underwriting & Investment Exhibit (1B) and Exhibit of Other Liabilities by Line of Business.
Based on our analysis of the annual statement’s Underwriting & Investment Exhibit (1B) and Supplement A to Schedule T.
For additional information on how reserves have developed through September 30, 2025, see Brown and Julga (2026).
Data from a proprietary Milliman database of HPL claims; calculations performed by the authors of this paper.
The Benktander method, as used in this analysis, is commonly referred to as “the BF of the BF.” The results of the BF method serve as the a priori ultimate in the Benktander method. This method assigns more credibility to the actual reported losses and less to the prior estimate.